
Deep Dive: About the temperature dependence of CO₂ efflux in our EW experiments
We have been monitoring the CO₂ efflux of 400 enhanced weathering (EW) experiments in our greenhouse since summer 2023. Please refer to our article describing the fluxmeters and our working paper about our insights for details.

View of our greenhouse with 400 lysimeters and a set of fluxmeters in the foreground
After publishing these papers we received the question whether the dependency of soil respiration on temperature (referring to Lloyd/Taylor 1994) could explain the notable CO₂ efflux differences that we observed, especially the increase of CO₂ efflux after rock amendment for many variations, which wasn’t exactly what we expected.
In this document we will look at this data. The graphs are based on the same pruned efflux data presented in the two articles mentioned above: we are only looking at night time data (light below 10 lux) from July to December 2023, filtering out clogged pots and stuck chambers. We found this data to be the best fit with our reference fluxmeter (LI-COR) as described in our articles.
Since all pots of one experiment set (=control and all variations) stand next to each other in our greenhouse, they experience practically the same ambient conditions (temperature, light, humidity, CO₂, etc.). As shown below we found that the differences in CO2 effluxes between treatments/controls are maintained across the whole temperature spectrum. So the increased CO2 efflux of certain soil/rock dust variations is observable across the whole temperature spectrum.
In our greenhouse the soil/rock combinations experience more time at higher temperatures than what would be the case in an outdoor setting. Because the CO2 efflux has an exponential relationship with temperature, our experiment likely over-exaggerates the total aggregate efflux measured over 6 months (more time is spent at higher temperatures with exponentially more efflux) and with it also the linear differences between treatments and control are over-exaggerated. But as our data below shows, the differences are notable across all temperatures, so the increase in efflux would still be visible even in an outdoor setting. The fact that we see an increase in efflux after rock treatment does not seem to be related to temperature effects.
Our greenhouse experiment was specifically designed to enhance the processes in the pots including the weathering processes (see blog article Turn it to *11*! The greenhouse tactics that accelerate our ERW research) and we think with this we have increased the speed of these processes by a factor of 2-3, compressing 2-3 years into one year.
The following two graphs are the main data presentation of this blog article:

They plot the average hourly CO2 efflux measurements in the y-axis (log-scaled on the right) and the average temperature in the chamber measured at the beginning of the chamber cycles (which occur every 10 minutes) on the x-axis, which acts as an equilibrated proxy (upper estimate) of the pots’ soil temperatures. For each experiment (according to the soil type rock dust was added, namely LUFA 6S, LUFA 2.2 and LUFA 2.1 and Fürth soil) CO2 efflux measurements were carried out simultaneously for all soil-rock dust variations on 4 replicate soil-rock dust pots. Thick black lines represent the CO2 efflux of the untreated control whereas the coloured lines are different rock dust additions. The expected exponential dependence between temperature and CO2 efflux is visible (straight trendlines on log-axis).
The downward bump between 19 °C and 23 °C is explained by the fact that most of the data for this temperature range was generated in the months October, November and December, which skews the data. The following barchart shows the number of hourly points discerned by air temperature: the data for 19-23°C is strongly dominated by data from months 10, 11 and 12 (green, orange, cyan).
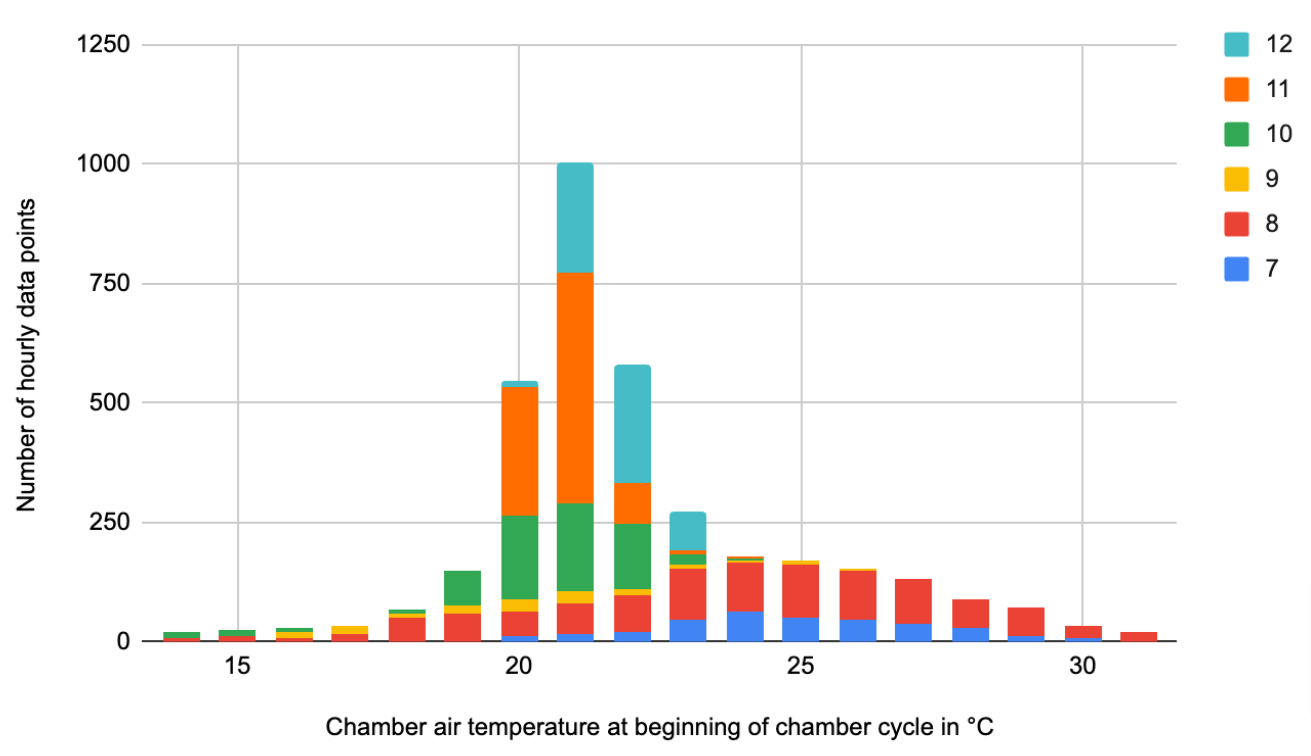
These three months represent a completely different phase of the annual growth cycle. The amount of light in these months is drastically less than in the months July, August and September, greatly reducing the plants' activity and ability of doing photosynthesis, so they will also pump much less CO₂ into the soil.
If we only look at the data for months 7, 8 and 9 the efflux graph loses this negative anomaly and shows an almost linear trend on the log scaled y-axis, as expected.

Whether we look at the CO2 efflux data only from the summer or from the entire second half of 2023, the overall trends of the rock dust variations in comparison to their control are maintained across the whole temperature spectrum.
Here is the same data, but showing all data points in detail and their individual error bars (90% CI):

The fact that the increase in CO2 efflux is maintainted across the whole temperature range is visible.
In essence, the differences in CO2 efflux that we observe between control and treatments do not seem to be caused by temperature differences between them as there are no notable temperature differences between them.

Please read on in the PDF file of our data collection document with many more graphs and insights. We are looking at the detailed data from our main soils in combination with basalt (x.2), diabase (x.6), dunite (x.7) and steel slag (x.8).
Download the PDF document (4 MB, 11 pages).